Modulation Error Ratio
By Ron Hranac
One of the most widely used metrics for characterizing the health of digital signals carried in cable networks is modulation error ratio (MER), or more specifically, receive modulation error ratio (RxMER). As useful as RxMER is, it doesn’t always tell the whole story.
What is MER?
Let’s start with what it’s not: carrier-to-noise ratio (CNR) that one measures with a spectrum analyzer or similar test instrument. From [1], “Carrier-to-noise ratio, abbreviated C/N ratio or CNR, is in cable industry vernacular a pre-detection measurement—that is, a measurement performed in the frequency domain. CNR is the difference, in decibels, between the amplitude of an RF signal and the amplitude of noise present in the RF signal’s transmission path.” For decades the cable industry has tried to ensure good (high) CNR values for the analog and digital signals in its networks. But good CNR does not necessarily guarantee good MER. More on this later.
If CNR and MER aren’t the same thing, then what is MER? Here’s the answer: MER, expressed in decibels, is the ratio of average signal constellation power to average constellation error power. Note: Some in the cable industry use “signal-to-noise ratio (SNR)” when what is meant is modulation error ratio. For legacy digital video and DOCSIS single carrier quadrature amplitude modulation (SC-QAM) signals, MER is computed in a QAM receiver after demodulation. Figure 1 shows a block diagram of a generic QAM receiver; the section that computes RxMER is circled in red.
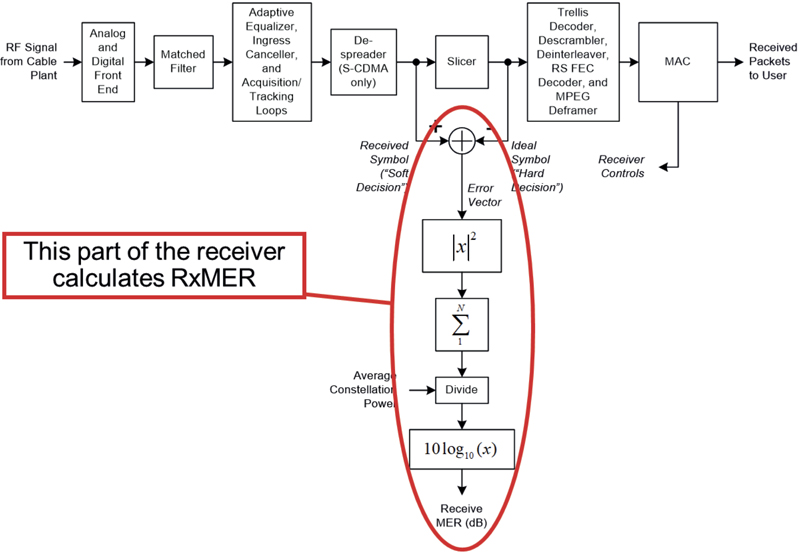
Figure 1. Block diagram of a generic QAM receiver, from [2].
A simple mathematical definition is MER = 10log10 (average symbol power/average error power). See Figure 2.
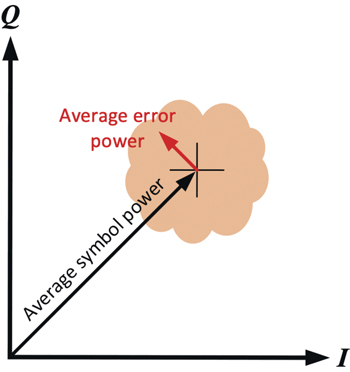
Figure 2. Relationship of average symbol power and average error power in a simplified constellation. The bigger the cloud of symbol points, the worse the MER; the smaller the symbol cloud, the better the MER.
In effect, MER is a measure of how “fuzzy” or spread out the symbol points are in a constellation. From this, you can see that the fuzzier or more spread out a data constellation’s symbol “clouds”—that is, the greater the average error power for a given average symbol power—the worse (lower) the MER.
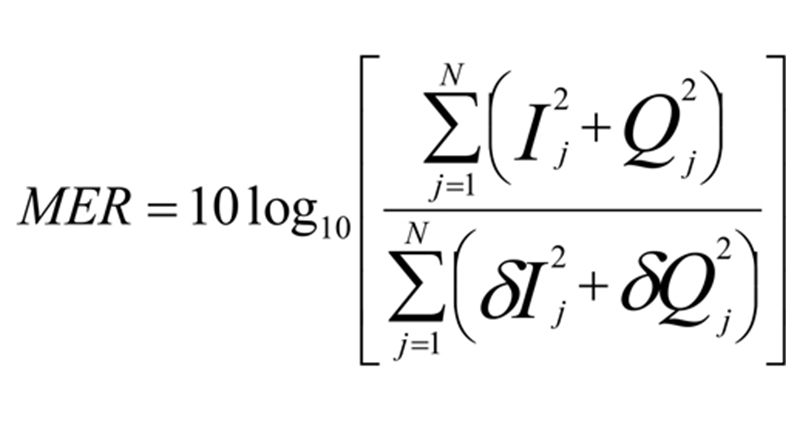
Now take a sip of strong coffee. From [2]: “Mathematically, a more precise definition of MER is:
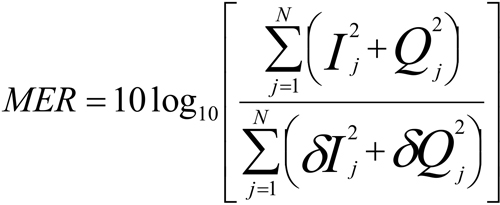
where I and Q are the real (in-phase) and imaginary (quadrature) parts of each sampled ideal target symbol vector, and δI and δQ are the real (in-phase) and imaginary (quadrature) parts of each modulation error vector. This definition assumes that a long enough sample is taken so that all the constellation symbols are equally likely to occur.”
Not to worry, there won’t be a test.
Why RxMER?
Under the umbrella of MER one will find transmit modulation error ratio (TxMER) and RxMER. TxMER is the MER produced by a transmitter under test—say, an edge-QAM modulator—as measured by an ideal test receiver. RxMER is the MER as measured in a digital receiver after demodulation, with or without adaptive equalization, and is what your field meters, set-top boxes, cable modems, and cable modem termination system (CMTS) upstream receivers compute and report.
The left side of Figure 3 shows a 16-QAM constellation whose RxMER is 27.5 dB. Notice the relatively small sizes of the clouds of symbol points. The right side of Figure 3 shows a not-so-good 16-QAM constellation, with a reported RxMER of 19 dB. Here the symbol point clouds are spread out quite a bit more than in the constellation on the left.
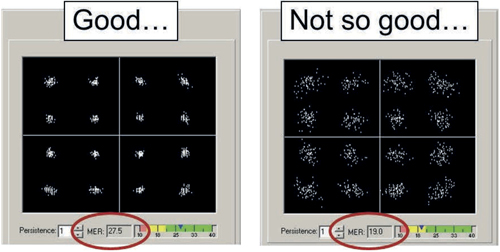
Figure 3. Good and not-so-good RxMER for two 16-QAM constellations.
What the computed and reported RxMER values don’t tell us is what’s causing them to be those values. That’s the missing part of the story. I often see social media posts by techs trying to troubleshoot low RxMER, and the ensuing confusion that sometimes occurs when the CNR is found to be good. What’s going on?
Culprits
RxMER is affected by pretty much anything in a digital signal’s transmission path that can degrade the quality of the channel through which the signal passes. Here are some examples.
- Transmitter and receiver phase noise—If severe enough to affect RxMER, you might have to repair or replace the problem device(s).
- Signal level—Low signal level into the cable modem (CM) can result in lower RxMER (measured in the CM) than CNR measured with test equipment in the plant prior to the CM. This is also true for low signal level at the CMTS’s upstream input.
- CNR—Low CNR means degraded RxMER, and high CNR usually means high RxMER. That said, if there are linear distortions present even when the CNR is good, the RxMER could be adversely affected.
- Nonlinear distortions—Composite triple beat (CTB), composite second order (CSO), cross modulation (XMOD), and common path distortion (CPD) can affect RxMER. In all-digital networks, distortions are noise-like, and if excessive, typically have the same effect on RxMER as low CNR. Non-linear distortion that occurs in the CM itself can impact RxMER but not show up in the CNR which is measured on the plant, even directly at the input to the CM.
- Linear distortions—The presence of micro-reflections, amplitude tilt/ripple, and/or group delay variation can degrade RxMER. Adaptive equalization can help, but only to a point.
- In-channel ingress—Got LTE? Both CNR (technically carrier-to-interference) and RxMER can be impacted.
- Laser clipping—This occurs when the laser for an optical link is overdriven. In addition to potentially creating packet loss, the RxMER and CNR can be impacted, too.
- Data collisions—Ouch!
Some of the factors that affect RxMER can be controlled fairly well, but no matter what we do, digital signals are going to be impaired as they make their way through our cable networks. The worse the impairments, the fuzzier or more spread out the constellation’s clouds of symbol points, and the lower the RxMER.
As such, the constellation’s clouds of symbol points will always be spread out at least a little, the extent of which is characterized by RxMER. By itself, the reported RxMER doesn’t tell us what caused it to be that value in the first place. If the RxMER is lower than expected, is the problem low CNR? Intermodulation distortion? Group delay? Ingress? Hard to say, until you do some additional troubleshooting.
What about OFDM RxMER?
DOCSIS 3.1 downstream orthogonal frequency division multiplexing (OFDM) and upstream orthogonal frequency division multiple access (OFDMA) channels comprise hundreds to thousands of 25 kHz- or 50 kHz-wide subcarriers, each of which is a QAM signal. DOCSIS 3.1 modems (and CMTS upstream receivers) can report RxMER per subcarrier (see [3]). But who wants to read through a list of potentially thousands of values? Fortunately, most field meters and some third-party tools support graphing RxMER per subcarrier.
The plot in Figure 4, from a Viavi field meter, shows a downstream 96 MHz-wide OFDM channel that has 1,880 50 kHz-wide subcarriers. The vertical axis is RxMER in dB, and the horizontal axis is frequency. The average RxMER is about 41 dB (for the curious, this screen shot was from my subscriber drop a few years ago). Figure 5 shows the effect of 20 MHz-wide LTE ingress on RxMER per subcarrier in an otherwise good OFDM channel (this one is not from my drop).
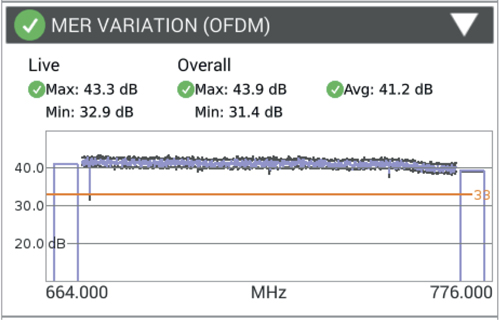
Figure 4. Downstream RxMER per subcarrier plot for a 96 MHz-wide OFDM channel.
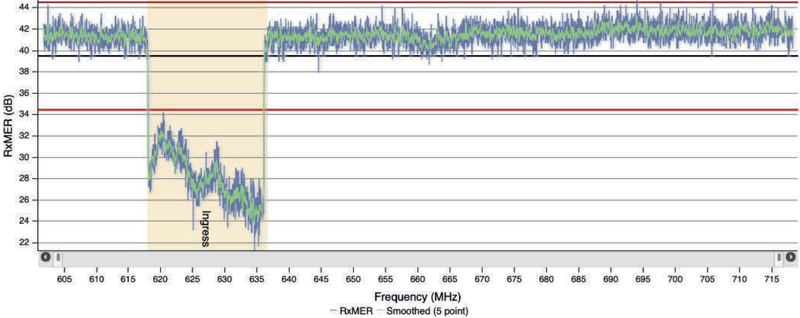
Figure 5. Downstream RxMER per subcarrier plot showing the impact of LTE ingress (image courtesy of Akleza).
Wrapping up
MER and RxMER are helpful metrics for cable network operation and maintenance, but it’s important to understand just what those metrics are telling you. If you’re interested in a deep dive into the subjects of CNR, SNR and MER, I suggest you take a look at the white paper [2] that Broadcom’s Bruce Currivan and I co-authored in 2006. Another good resource is a paper Bruce and I presented in 2011 [4].
Additional resources
[1] SCTE 270 2021r1, Mathematics of Cable (https://www.scte.org/standards/library/catalog/scte-270-mathematics-of-cable/)
[2] Currivan, B., and R. Hranac. “Digital Transmission: Carrier-to-Noise Ratio, Signal-to-Noise Ratio, and Modulation Error Ratio” (https://docs.broadcom.com/docs/1211168555947)
[3] Hranac, R. et al. “Characterizing Network Problems Using DOCSIS® 3.1 OFDM RxMER Per Subcarrier Data,” SCTE Cable-Tec Expo ’19, Fall Technical Forum Proceedings, September 30-October 3, 2019, New Orleans, LA (https://www.nctatechnicalpapers.com/Paper/2019/2019-characterizing-network-problems-using-docsis-3-1-ofdm-rxmer-per-subcarrier-data)
[4] Hranac, R., B. Currivan. “Understanding Real-World MER Measurements,” SCTE Cable-Tec Expo ’11, Technical Workshop Proceedings, November 15-17, 2011, Atlanta, GA.
Images provided by author.

Ron Hranac
Technical Editor,
Broadband Library
rhranac@aol.com
Ron Hranac, a 51 year veteran of the cable industry, has worked on the operator and vendor side during his career. A Fellow Member of SCTE and co-founder and Assistant Board Member of the organization’s Rocky Mountain Chapter, Ron was inducted into the Society’s Hall of Fame in 2010, is a co-recipient of the Chairman’s Award, an SCTE Member of the Year, and is a member of the Cable TV Pioneers Class of ’97. He received the Society’s Excellence in Standards award at Cable-Tec Expo 2016. He was recipient of the European Society for Broadband Professionals’ 2016 Tom Hall Award for Outstanding Services to Broadband Engineering, and was named winner of the 2017 David Hall Award for Best Presentation. He has published hundreds of articles and papers, and has been a speaker at numerous international, national, regional, and local conferences and seminars.