Signal Leakage Patrolling at 700 MHz (PART ONE)
By H. Mark Bowers
This subject has been addressed by others in the industry over the past several years, but recent field experience prompts me to believe that it needs further discussion. Newer leakage detection systems are now available that measure at dual frequencies. While {the} present FCC required leakage detection frequency range remains in the 108 MHz to 137 MHz aeronautical band, measurements at higher frequencies can be revealing and may eventually be required under modified FCC rules.
As I complete this article, FCC Report and Order — MB Docket No. 12-217 has just been approved, with changes pending to present FCC Rules including signal leakage. When patrolling at higher frequencies, I usually measure in the 700 MHz range where cellular LTE traffic is concentrated. Several years ago I patrolled a portion of a HFC plant, attempting to capture and compare whether leakage at aeronautical frequencies correlated with leakage in the 700 MHz range.
This testing made use of a real-time portable spectrum analyzer as I sought to verify and perhaps expand on valid issues that have been raised by other industry authors in past years. The advantages of a real-time spectrum analyzer (RTA) when performing these measurements are many, and the measurements in this article demonstrate why these instruments can be invaluable for accurate analysis in today’s crowded electromagnetic spectrum. The fundamental issues addressed are:
- Does leakage found in the 700 MHz frequency range in an HFC plant correlate, to any degree, with leakage in the 108 MHz to 137 MHz aeronautical range at the same location?
- Does leakage appear to be ‘a general issue’ in the 700 MHz range, even when the plant is found to be ‘leakage free’ in the aeronautical range?
- What are the implications for the cable operator and the cellular company where leakage/ingress does occur?
Test Conditions
The equipment employed in this testing was:
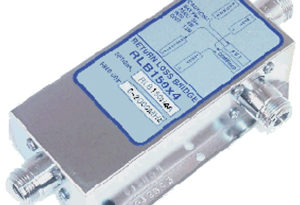
- A calibrated real-time spectrum analyzer, with an operational range of 10 kHz to 6.2 GHz. RF amplitude readings are in dBm as this is a 50 ohm input impedance device. To convert from dBm to dBmV, add 49 (48.75) dB.
- Two omni-directional antennas; one tuned for a frequency range of 100 MHz to 150 MHz, while the second was tuned for 700 MHz to 900 MHz.
- The analyzer has a calibrated ‘field strength’ mode where internal tables are employed to track and adjust for antenna gain along with connecting cable loss at the measured frequency; thus it automatically calculated calibrated field strength readings in microvolts per meter (μV/m) as leaks were measured in either frequency range.
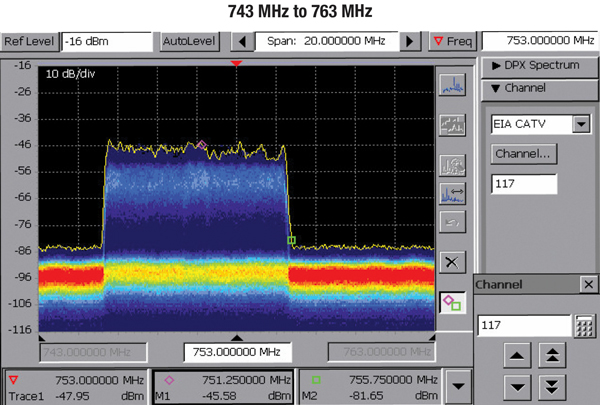
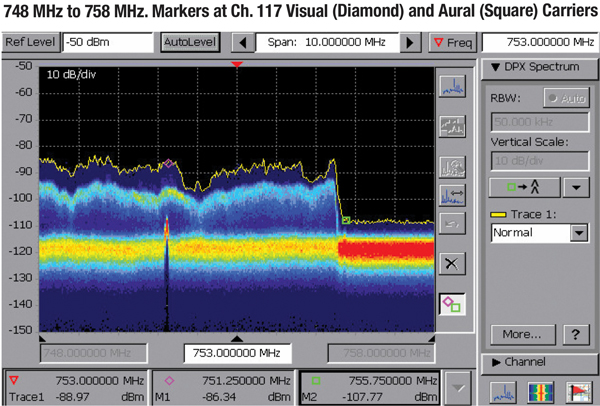
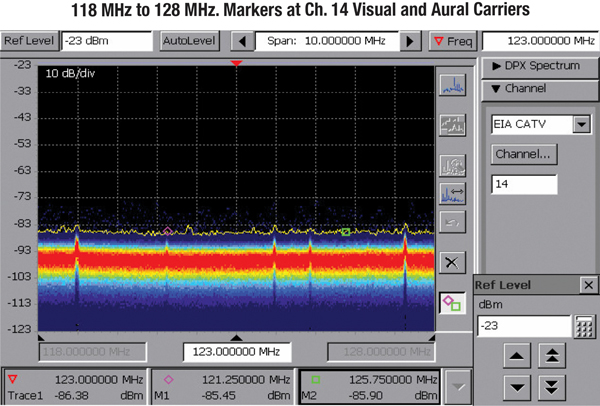
I also chose to use the analyzers ‘digital persistence’ mode. This feature is available on a variety of digital spectrum analyzers and is known by various names depending on the manufacturer. If you are unfamiliar with this type of display (various colors represent the percentage of time spectral energy is present at a specific frequency and amplitude), please refer to articles I’ve written on this subject.
I deliberately chose a small rural HFC cable system that I thought was well maintained and I believed would reveal few leaks in the aeronautical band. Cellular coverage in this location was unknown before arrival on-site; however I quickly determined that there was a Verizon tower located on the east-central edge of the community utilizing LTE Band 13, with a downlink frequency allocation of 746 MHz to 756 MHz. This band overlapped CTA channels 116 and 117 in the HFC plant. The test system utilized Ch. 116 for a 256-QAM carrier and Ch. 117 for an un-modulated analog (pilot) carrier. After preliminary measurements in several locations, I decided that measurement using the Ch. 117 analog luminance (and aural) carriers would provide for the most accurate low-level leakage measurements. The LTE Band 13 uplink frequency allocation of 777 MHz to 787 MHz (Ch. 121 and Ch. 122) was not utilized in the cable system so activity in this spectrum was not measured.
With that decided, I patrolled an estimated 50 percent of the plant that was mostly aerial. I made the decision to patrol as much of the physical plant as was possible in a day, but to not take time to determine the precise source mechanism of any leakage discovered.
In Part Two of this article we’ll examine testing results from two other locations where correlation was found, and then draw some broad conclusions based on all the tests documented during that driveout.
 H. Mark Bowers,
Cablesoft Engineering, Inc.
Mark is VP of Engineering at Cablesoft Engineering, Inc. He has been involved in telephony since 1968 and the cable industry since 1973. His last industry position was VP of Corporate Engineering for Warner Cable Communications in Dublin, OH. Mark’s education includes the U.S. Naval Nuclear Engineering School, and BS and MS Degrees in Management of Technology. Mark is a member of the SCTE, the IEEE, and is a Senior Member and licensed Master Telecommunications Engineer with iNARTE.
Credit: Charts provided by author
Credit: Shutterstock.com