How Do We Use Optical Power Budgets?
By Steven Harris
How Do We Use Optical Power Budgets?
Most operators have been heavily investing in optical fiber connectivity for their customers over the past few years, and 2021 will be no different in our industry. With numerous new fiber networks and varying designs, it will be important for our workforce to properly maintain these optical networks. Operators must ensure proper optical power levels between a transmitter (Tx) and receiver (Rx), otherwise poor metrics will hinder the customer quality of experience (QoE). To properly maintain optical power in our networks, a budget is engineered and utilized. An OTDR is a terrific tool to characterize these networks. However, in the absence of an OTDR trace, an optical power budget or link budget analysis may be used to quantify losses and determine proper Rx values.
What is it?
An optical power budget describes the total optical power available from an optical source (Tx) to an optical receiver (Rx) in the downstream, as well as the Tx to Rx for the upstream, in addition to the total optical loss between Tx and Rx. The budget is typically represented by a relative measurement known as decibels (dB). Tx power and Rx power levels are expressed in decibels referenced to 1 milliwatt (mW), or dBm. For example, in FTTH that would be the budget between an optical line terminal or OLT (at the operator) to an optical network unit/terminal or ONx (at the subscriber). An example budget may be 28 dB of optical attenuation from OLT to ONx. Operations will maintain the budget in an optical distribution network or ODN for FTTH, as well as an HFC network for DOCSIS.
Why do we need it?
An optical power budget provides a standard practice for engineers and our field folks, guiding them for successful deployments. As the workforce interacts with an optical network by means of installs, upgrades or repairs, the budget facilitates successful operation of products and services. For example, if an additional optical splitter was added to the network, this would increase the bidirectional network path loss by at least 3.01 dB ideally (or as much as 4 dB). Interpretation of the budget allows the workforce to know the implications of these alterations and how they will affect an ONx, HFC optical node, remote PHY device (RPD), etc. Exceeded budgets may reduce overall QoE.
What is needed to calculate a budget?
Individuals must be aware of all the path losses or elements that attenuate an optical signal. These losses are typically expressed in dB; however, mW may be used to characterize network losses. Why two options? Well, dB is the relative measure for power, which may be easier to utilize as it has the capacity to represent both large and small values in a short form, while mW is an absolute measurement for power and may be necessary to keep values in watts (W). Most optical power meters (OPM) will support both values. In addition, newer meters have support for multiple wavelengths necessary for FTTH. Finally, knowing the Tx optical power level (e.g., +2 dBm), as well as the Rx optical power sensitivity (e.g., -27 to -3 dBm) will be essential in using a budget.
There are two items that will make it easier for calculating budgets. First is having an awareness of the dBm and mW rules. These rules make it easier to do calculations without a calculator or OPM. Figure 1 provides a list of the rules, making it easier to move between relative and absolute values, as well as estimating power levels in the network. Tech Tip, the rules also apply to receive signal strength indicator (RSSI) values used for healthy Wi-Fi networks!
Second, understanding the formulas for calculating dBm and mW values will come in handy. Figure 2 provides the two commonly used formulas for calculating optical power. For example, a +3 dBm optical value would equal 2 mW or 10(3/10) or 10(.3) or 1.995 mW. Another example, a 2 mW optical value would equal +3 dBm or 10*log10(2/1) or 10*log10(2) or 10*.3 or 3 dBm. Perhaps Figure 1 is a better way to go?
Now that we have a fundamental understanding of relative and absolute values, let’s put them to work. We may use Figure 1 to provide field estimates when a calculator or OPM are not present. For example, having a known of +23 dBm where a mW value is required. To convert dBm to mW, always start with rule #1, 0 dBm = 1 mW. Using the powers of 3 dB and 10 dB from Figure 1, how do we advance from rule #1 to +23 dBm? Well that would be +10 dBm +10 dBm +3 dBm or +23 dBm. Now to calculate mW, several additional rules will be applied. First, rule #5 states that for each 10 dB increase the absolute value in watts will increase by 10 times. Starting from rule #1, the result would be 1 mW x 10 x 10 or 100 mW. Second, rule #3 states that for each 3 dB increase the absolute value in watts is doubled. Continuing from rule #5, the result would be 100 mW x 2 or 200 mW. This is a handy method when folks want more of an estimate in the field. It will also allow mW to dBm estimates.
Calculate the budget
Now that we understand the dBm and mW values, let’s return to the budget. A budget equation will take into account the various forms of loss that will be experienced in a fiber optic network, as well as any margins. For example: connectors, splices, fiber lengths (per km), optical splitters (actual), and multiplexing elements will contribute to the loss of an optical transmitter’s launch power, while a gain such as an amplifier will contribute additional optical power. In Figure 3, the total loss adds up to 26 dB. If an operator is using a +2 dBm Tx to a 10 gig EPON ONU, the receive power will be -24 dBm. The ONU’s lower receive sensitivity was -27 dBm, which is acceptable in our example. If the operator added 2 dB of margin for additional splices and connectors in the future, the ONU would remain operational at -26 dBm.
Soon more of us will interact with optical networks, and working with dBm/mW, estimating optical power and calculating a budget will become more common. To learn more or become professional certified visit SCTE.org/BPI.
—
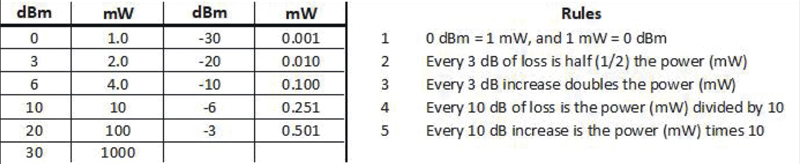
Figure 1. dBm to mW conversation table
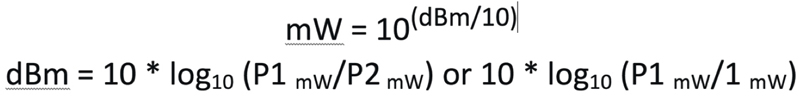
Figure 2. dBm and mW formulas for calculating optical power levels
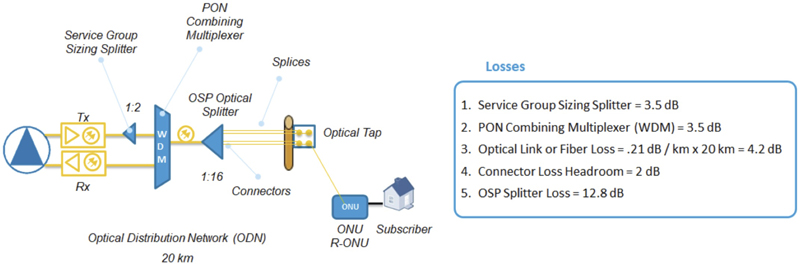
Figure 3. PON loss elements
 Steven Harris
Executive Director, Technical Sales, Learning & Development
SCTE•ISBE
sharris@scte.org
Steve is an international SME and thought leader, and the executive director of education and business development for SCTE·ISBE. He is responsible for overseeing the architecture and evolution of educational programs, credentialing, and customized career progressions, as well as business development and partnerships. His team is responsible for an education library that is now 900+ modules, designed to drive business results. With more than 30 years in education, he has taught much of the content of the library, with a dynamic approach to the delivery of highly complex topics.
Shutterstock