Full Band Capture Revisited
By Ron Hranac
One of the most versatile pieces of test equipment available to the cable industry is the spectrum analyzer. Spectrum analyzers, which are instruments that display signals in the frequency domain (see Figure 1) have for decades been used for headend, hub site, and outside plant maintenance and troubleshooting. However, spectrum analyzers have historically been expensive and not typically available to field personnel; usually not particularly portable; and in some cases complicated to use.
That said, wouldn’t it be nice to have a spectrum analyzer in every cable subscriber’s home? What if those in-home spectrum analyzers could be remotely accessed so that technicians didn’t have to go to each home to use them? Even better, what if that in-home spectrum analyzer capability already existed and was widely deployed?
Let’s answer those three questions in reverse order, starting with the last one first: In-home spectrum analyzer capability does exist and has for several years. Those in-home spectrum analyzers can be remotely accessed, using simple network management protocol (SNMP) or similar. And while not in every cable subscriber’s home, they are in a sizeable percentage of homes with Data-Over-Cable Service Interface Specifications (DOCSIS®) customer premises equipment (CPE).
That in-home spectrum analyzer capability is known as full band capture (FBC) and is a cable modem spectrum analysis feature available in DOCSIS 3.0 and 3.1 cable modems. Cable modem spectrum analysis functionality was first defined in version I20 of the DOCSIS 3.0 Operations Support System Interface Specification (CM-SP-OSSIv3.0-I20-121113) back in November 2012.
Figure 2 shows an example of an FBC display of the downstream in a cable network. More specifically, the data was captured remotely from an FBC-capable DOCSIS modem in the home of yours truly, showing a problem-free downstream spectrum. The vertical axis is amplitude, the horizontal axis is frequency in MHz, and the resolution bandwidth (RBW) is 117 kHz.
Figure 3 is another example of an FBC display of a cable network’s downstream spectrum, and shows a suckout (notch) in the vicinity of 625 MHz that would otherwise have been difficult to identify without having a technician on-site.
Figure 4 shows a classic standing wave (amplitude ripple), caused by an impedance mismatch, plus FM ingress at the left edge of the display.
Some operators have been using FBC successfully as part of their proactive network maintenance (PNM) programs. But many operators have not taken advantage of FBC, perhaps because they don’t know about it, or don’t know how to use it. Whatever the reason, FBC is a powerful tool that is supported in most DOCSIS 3.0 and all DOCSIS 3.1 cable modems.
FBC benefits
FBC allows operators to obtain remote spectrum captures at the subscriber premises without having to take an expensive spectrum analyzer into the field; without requiring physical access into subscribers’ homes; and without having to roll a truck to initially identify problems! Key benefits of FBC include significant operational advantages, not to mention operational cost savings.
With a substantial number of FBC-capable DOCSIS cable modems already deployed, these devices have gathered critical mass and are now in a large percentage of subscribers’ homes. As such, operators can use FBC to identify individual drop problems, and correlate RF spectrum signatures from neighboring modems to troubleshoot and locate distribution network problems affecting groups of modems.
Automating impairment detection
Clearly, having the equivalent of a spectrum analyzer in every home that has an FBC-capable modem provides powerful troubleshooting and maintenance capabilities. However, it is simply not practical for cable operators to manually look at every modem’s FBC spectrum data. What to do? The good news is that automated spectrum signature analysis and impairment detection are available to scale the analysis to the millions of modems deployed with FBC functionality. Anomaly detection and classification algorithms are available through CableLabs, and are built into commercially available PNM tools. All of this can be done remotely!
Wrapping up
FBC spectral displays can show impairments such as ingress, frequency response problems, the presence of filters, incorrect narrowcast versus broadcast signal levels, and much more. Furthermore, those spectral displays are intuitive and easy to understand. A key benefit is that many problems can be identified remotely without the need to first roll a truck.
The industry has been given a valuable and powerful tool for plant maintenance, and software exists to integrate FBC with operational practices. The opex is out there, waiting to be saved!
This issue’s column is excerpted from a Fall Technical Forum paper presented by the author during October’s virtual SCTE·ISBE Cable-Tec Expo. A big thanks to the paper’s coauthors: Chad Campbell, Intraway; Roger Fish, Broadcom; Tom Kolze, Broadcom; Even Kristoffersen, Telia Norge; James Medlock, Akleza; Jason Rupe, CableLabs; Paul Schauer, Comcast; Aleksander Søberg, Telia Norge; Tom Williams, CableLabs; and Larry Wolcott, Comcast. For more information about FBC, including a detailed discussion about how to retrieve spectrum data from modems (and sample Python scripts), refer to the Expo paper. The full paper is available at https://www.nctatechnicalpapers.com/Paper/2020.
—
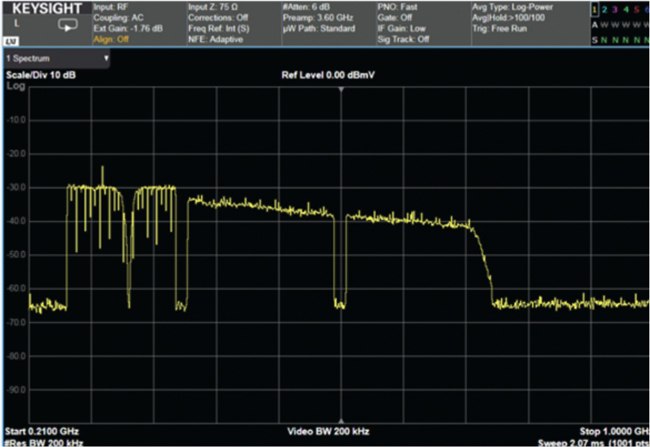
Figure 1. Lab spectrum analyzer screen shot showing SC-QAM signals on the left side and two DOCSIS 3.1 OFDM signals. Several intentional impairments are visible. The vertical axis is amplitude, and the horizontal axis is frequency.
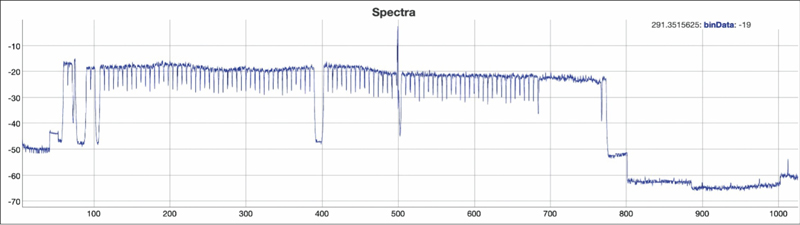
Figure 2. FBC screen shot of a cable network’s downstream spectrum from a DOCSIS modem in the home of the author (courtesy of Comcast).
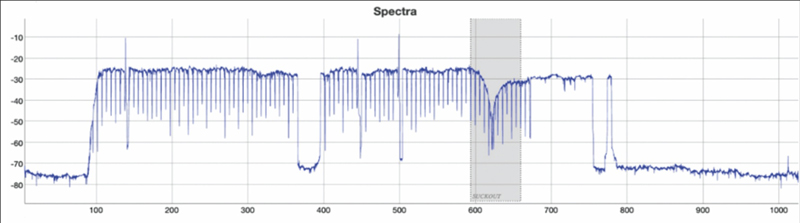
Figure 3. FBC screen shot of a cable network’s downstream spectrum. This display shows a suckout (notch) at about 625 MHz; the gap just below 400 MHz is unused spectrum (courtesy of Broadcom).
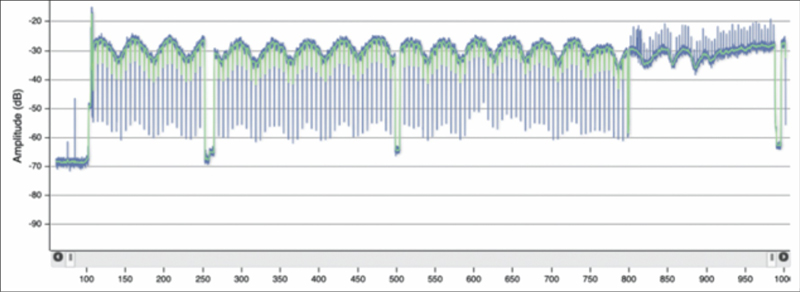
Figure 4. Standing wave; note FM radio ingress visible at the left end of the display (courtesy of Akleza).
 Ron Hranac
Technical Editor,
Broadband Library
rhranac@aol.com
Ron Hranac, a 48 year veteran of the cable industry, has worked on the operator and vendor side during his career. A Fellow Member of SCTE and co-founder and Associate Board Member of the organization’s Rocky Mountain Chapter, Ron was inducted into the Society’s Hall of Fame in 2010, is a co-recipient of the Chairman’s Award, an SCTE Member of the Year, and is a member of the Cable TV Pioneers Class of ’97. He received the Society’s Excellence in Standards award at Cable-Tec Expo 2016. He was recipient of the European Society for Broadband Professionals’ 2016 Tom Hall award for Outstanding Services to Broadband Engineering, and was named winner of the 2017 David Hall Award for Best Presentation. He has published hundreds of articles and papers, and has been a speaker at numerous international, national, regional, and local conferences and seminars.