Signal Quality Characterization of RF Communication Systems
By Pratyusha Malladi
This article examines the dependencies of various metrics that define the quality of radio frequency (RF) systems in wireless and wireline RF communication systems. Multiple factors play a crucial role in determining the performance and reliability of RF communication systems such as cellular, Wi-Fi and DOCSIS applications.
Understanding these factors is essential for fair performance comparison between different RF devices and systems. By considering the factors defined in this article, users can make informed decisions when evaluating and selecting RF equipment.
UNDERSTANDING SIGNAL DEFINITIONS
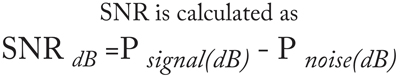
SNR, often written as S/N, is the most fundamental measurement of signal quality in communication systems. SNR, or signal-to-noise ratio, quantifies the ratio of the power of the desired signal to the power of the background noise or interference present in the signal.
Positive SNR means that the signal power is greater than the noise power allowing the receiver to demodulate the signal. Communication systems use multiple measurements that correlate to the SNR of a device. Often, vendors use the terms MER and RSSI interchangeably with SNR to define signal quality.
MER (Modulation Error Ratio)
MER is a popular metric used for signal quality measurement in DOCSIS HFC systems. It is the ratio, in decibels, of average symbol power to average error power. MER is, in effect, a measure of the “fuzziness” or spreading of an I/Q constellation’s clouds of plotted symbol points.
The wider the spread, and/or the more outlying points in the clouds, the lower the MER. Higher MER means a cleaner signal for delivery to/from the customer. As shown in the figure the MER is the difference between the target symbol location and the transmitted symbol.
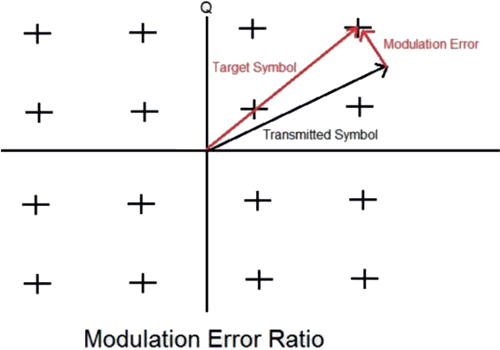
Figure 1. Example of modulation error in an IQ constellation.
RSSI (Received Signal Strength Indicator)
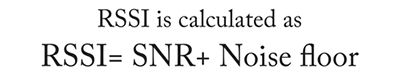
RSSI is commonly used in wireless systems like Wi-Fi and cellular networks as a major indicator of signal quality. It represents the power level of the received signal as it arrives at the receiver’s antenna.
An RSSI metric used is decibel milliwatt (dBm) and indicates the strength of the received signal. A higher RSSI value often implies a stronger received signal, indicating better signal quality and potentially a higher data rate or stronger connectivity. To assess the quality of a signal, it is important to consider the RSSI value in relation to the noise floor. A strong signal with a high RSSI value relative to a low noise floor indicates a good carrier-to-noise ratio (CNR or C/N) which results in higher SNR.
NPR (Noise Power Ratio)
The NPR is a commonly used metric for evaluating the RF performance of multi-carrier systems. It provides valuable information about the system’s maximum distortion-free dynamic range. The NPR measurement technique helps assess the combined effects of noise and distortions produced by the device or system under test. It measures the system’s ability to handle multiple carriers without introducing excessive degradation. This characterization is essential for understanding the system’s performance in handling complex signals.
A higher NPR value and dynamic range indicate a larger operating headroom, meaning there is more room available before the system’s performance degrades due to noise and distortions. It suggests a cleaner and more reliable system, allowing operators to select optimal input levels based on a target performance and margin. Conversely, a lower NPR value indicates either a higher level of distortion or noise which would potentially degrade the received signal quality. It suggests that the system may not be optimized, leading to compromised performance and reduced signal integrity.
CONSTELLATION PLOT OF TRANSMITTED SIGNALS
In a digital communication system receiver, QAM symbols are represented by points in an IQ constellation diagram. The I-axis represents the in-phase component of the signal, and the Q-axis represents the quadrature component. Each symbol corresponds to a specific combination of amplitude and phase represented by its position in the IQ plane.
Factors such as noise, interference, and distortion can cause the received symbols to deviate from their ideal positions in the constellation. The spreading or clustering of the symbol points in the IQ plane provides insights into the signal quality, potential errors, and the effectiveness of error correction techniques.
NOISE FACTORS
While designing an RF chip in a communication system, undesired noise is an important consideration as it can significantly impact the performance and functionality of the chip. There are various sources of noise that should be considered when evaluating the performance of these RF chips, described in the following paragraphs:
Noise Figure: The noise figure and the SNR are related in the context of RF communication systems. The noise figure quantifies the additional noise introduced by each component, such as an amplifier or receiver, in a communication system. A lower noise figure indicates better performance, meaning less additional noise is introduced.
Thermal Noise: Also known as Johnson-Nyquist noise, thermal noise is a fundamental noise present in all electronic components and circuits. It arises due to random thermal motion of electrons and is proportional to temperature. Thermal noise contributes to the noise floor of the system.
Environmental Noise: RF systems can be affected by external sources of noise, such as atmospheric noise, and electromagnetic interference (EMI) from other devices or systems.
Shot Noise: Shot noise, also known as quantum noise, is generated by the random arrival of electrons in a current-carrying component. It is particularly relevant in low-level RF systems or systems operating at high frequencies. Shot noise can limit the system’s sensitivity and introduce fluctuations in the received signal.
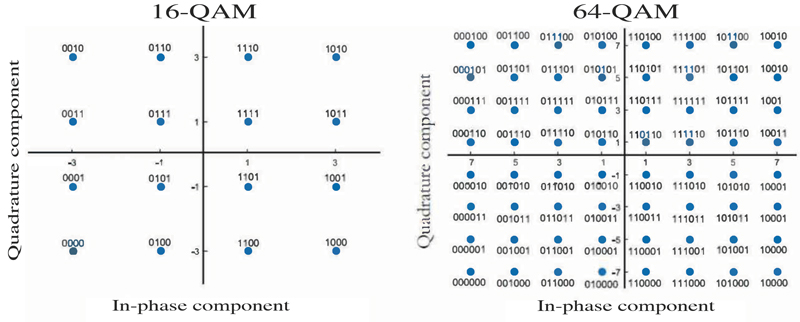
Figure 2. Quadrature amplitude modulation schemes in an IQ constellation.
Phase Noise: Phase noise refers to the random fluctuations in the phase of an RF signal. It can be caused by imperfections in the frequency generation and synchronization mechanisms. Phase noise can impact the performance of RF systems, especially in applications requiring high spectral purity and signal stability.
DISTORTION FACTORS
Other considerations affecting equipment performance are undesired distortions such as those described in the following paragraphs.
Crosstalk: This occurs when signals from one RF channel or circuit interfere with signals in an adjacent channel or circuit. This can happen due to inadequate isolation between components, improper grounding, or electromagnetic coupling. Crosstalk can lead to interference and signal distortion.
Passive Intermodulation: When multiple signals pass through nonlinear components, such as connectors and other passive devices, they can add or subtract to generate intermodulation products. These intermodulation products can fall within the frequency band of the desired signal, causing interference and degrading signal quality.
Impulse Noise: Impulse noise consists of bursts of high-amplitude disturbances in the RF signal and can be caused by lightning strikes, power line switching, or faulty electrical equipment. Impulse noise can disrupt communication temporarily and introduce errors in the received signal.
Noise and distortion mitigation techniques
RF chip designers use several techniques to counteract the effects of noise and distortions on the received signal. Some of these methodologies used today are:
Utilizing low noise components such as low noise amplifiers (LNAs) with low noise figures within the design.
- Proper grounding and shielding techniques.
- Advanced filter designs and signal conditioning.
- Noise cancellation.
- Circuit design optimization.
The noise at the receiver P noise (dB) is calculated using the simple formula: P noise (dB) =kTB
k Boltzmann’s constant = 1.38 x 10⁻²³ J/K
T System noise temperature in kelvin.
B Signal bandwidth in Hz
COMPARING DEVICES
Now that you know how internal noise within the chipset can affect SNR, one can observe the sampling of two different cable modem termination systems (CMTSs) when subjected to the same level of additive white Gaussian noise (AWGN) as shown by Figure 3 and Figure 4.
OBSERVATION
Small variations exist between these devices reacting to the same level of noise. This behavior can often be associated to:
- Level variations due to changes in amplifier thermal noise.
- The sensitivity of the upstream burst receiver chip that is also responsible for the variation in the SNR.
- The difference in noise figures for internal components.
- The difference in sampling intervals between devices.
CONCLUSION
While SNR, MER, BER and RSSI are measures of signal quality it is vital to understand that relying exclusively on signal quality metrics for characterizing RF communication systems is insufficient and unreliable as they do not provide a comprehensive view of all aspects of the system’s performance. Also, there are other factors such as carrier interference, multipath propagation, modulation schemes, coding techniques, and channel conditions that can significantly impact overall system performance.
Different measurement methodologies, equipment calibration, and RF receiver characteristics can lead to inconsistent results. This makes it challenging to compare systems, or even draw definitive conclusions based only on these metrics.
To properly characterize and compare RF communication systems, it is necessary to consider a broad range of measurements and techniques that address system performance. These include but are not limited to NPR, spurious, harmonics, noise figure, frequency stability, group delay, a link budget analysis and system-level simulations.
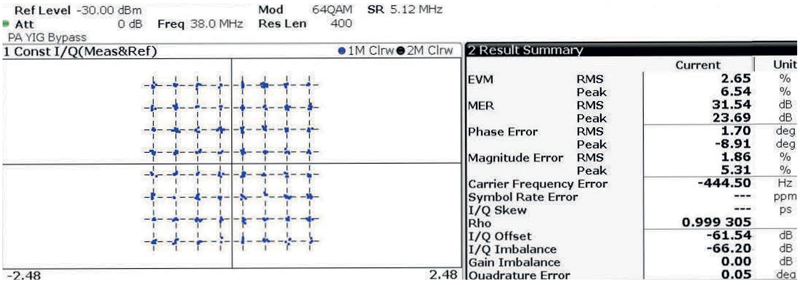
Figure 3. CMTS #1
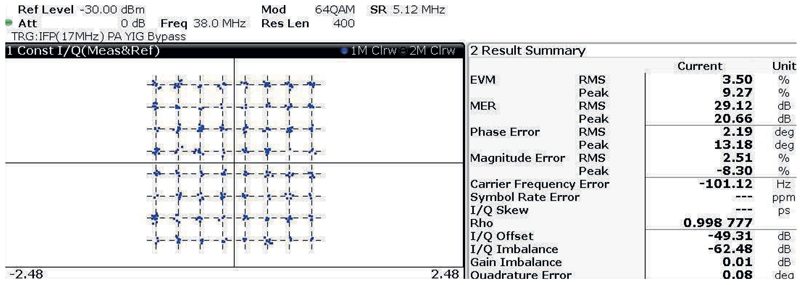
Figure 4. CMTS #2
 Pratyusha Malladi,
Principal Engineer,
Charter Communications
Pratyusha Malladi is a seasoned wireless technology professional with extensive expertise in algorithm and protocol testing, Wi-Fi CPE, network engineering, and RF design. She has a proven record of providing technical leadership, developing test methodologies, and ensuring optimal performance of wireless products with a strong background in LTE, WLAN, and DOCSIS technologies. Pratyusha is an active member of the SCTE Rocky Mountain Chapter.
Images provided by author