Optimizing Video Customer Experience with Machine Learning
By Mariela Fiorenzo and M. Cecilia Raggio, Fernando Ochoa, Claudio Righetti
In recent years artificial intelligence (AI) and machine learning (ML) have been transforming our industry in many different areas. The main application of AI in the telecommunications industry is in the network management area. There are also multiple initiatives to improve customer experience using AI and ML. But, do we really need ML to do this? In this article we give the answer and an approach to some technical challenges we are facing in order to optimize our video customer experience.
Measuring Video Quality
Videos have several characteristics that determine their quality: resolution, frame rate, aspect ratio, color model, etc. Furthermore, the videos are digitized, compressed and transported through a network before reaching the final device. For this, there are also a diversity of methods with different characteristics that affect the final perception of the users. For video service providers it is important to evaluate the processes that affect the quality of videos considering the customer’s perception.
The subjective evaluations measuring the opinion of human users are expensive and slow. To automate these evaluations, there are objective models that try to approach them. These objective models can be applied on a large scale because they are executed by a computer.
Recently, new metrics have emerged that use machine learning algorithms to improve the measurement of video quality. While the objective evaluations are widely used given their relatively simple implementation, they do not necessarily reflect the user’s opinion. The techniques based on machine learning use databases with the opinion of real users about the quality of a lot of videos to do the training.
Within these new metrics there are two methods that produce similar results: video multimethod assessment fusion (VMAF) and video quality model with variable frame delay (VQM-VFD). VMAF is an open-source method proposed by Netflix in 2016 and VQM-VFD was standardized by ITU in 2003.
What is Machine Learning?
The field of machine learning addresses the question of how to build computer programs that automatically improve with experience via the training and testing datasets. In the last few decades, many successful applications have been developed and they are developing more and more, year by year. Applications include data mining programs that learn to detect fraudulent bank transactions, churn prediction, recommendation systems based on user preferences, autonomous vehicles that learn to drive on public highways, and facial and voice recognition.
Support Vector Machines
Support vector machines (SVM) is a technique that works with labeled training data. It is highly preferred by many as it produces significant accuracy with less computation power and can be used for both regression and classification tasks. The objective of SVM algorithms is to find a linear decision boundary that can separate classes and has the largest margin between borderline points that are called support vectors. Maximizing the margin distance provides some reinforcement so that future data points can be classified with more confidence.
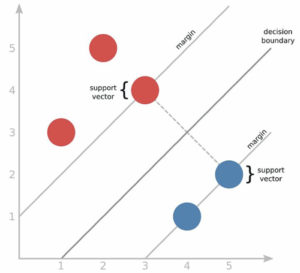
Fig. 1. Representation of support vector machines.
In practice, there often isn’t a linear decision boundary that completely separates the two classes in the training data. The solution to this problem is a very powerful generalization of SVM called “kernel SVM.” The idea of kernel SVM is to first map our points into some other space in which the decision boundary is linear, and then construct a support vector machine that operates in that space.
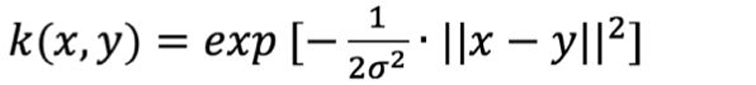
Generally, a kernel function is noted as k(x,y). And the one we used to perform our task is the RBF or Gaussian kernel:
SVM Parameters
When using a SVM, one of the things you need to choose is the parameter C which was in the optimization objective.
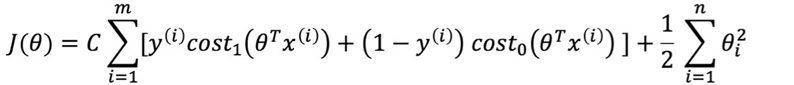
With a large C value, you tend to have a lower bias and high variance, and with a small C value, a higher bias and a low variance. It’s very important to control the variance and the bias because a high bias can cause underfitting and a high variance can cause overfitting. Particularly, overfitting is when the learned model may fit the training set very well but fail to generalize to new examples.
Another parameter we have to choose is σ2 which appears in the Gaussian kernel. If σ2 is large, we tend to have higher bias and lower variance. On the other hand, if σ2 is small, then we tend to have lower bias and higher variance.
Video Multimethod Assessment Fusion (VMAF) — The Dataset
First, it is necessary to design a dataset with a certain number source clips of about 10 seconds long of different genres and content characteristics. Then, to distort the videos, these source clips are encoded at different resolutions and bitrates.
The Algorithm
VMAF is a fusion of elementary metrics into a final metric using support vector machines regressor which assigns weights to each one of them. The final metric could preserve all the strengths of the individual metrics and deliver a more accurate final score.
The elementary metrics fused by SVM regression are:
• Visual Information Fidelity (VIF): considers information fidelity loss at four different spatial scales.
• Detail Loss Metric (DLM): measures loss of details and impairments which distract viewer attention.
• Temporal Information (TI): simple measure of the temporal difference between adjacent frames.
VMAF predicts one value per video frame and calculates the arithmetic mean over all per frame predictions to predict the overall video quality.
To avoid overfitting to the dataset, this has to be divided into training and testing subsets, with no overlapped clips.
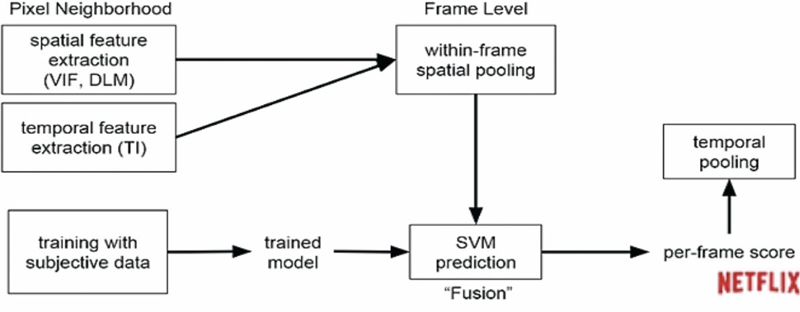
Fig. 2. How VMAF works.
Subjective Experiment and Scoring
The subjective experiment is used to determine how non-expert observers would score the impairments of an encoded video with respect to the source clip. The viewer sits in front of a 1080p display in a living room-like environment with a viewing distance of 3x the screen height and sees an unimpaired reference video, then the same video impaired. After that they are asked to vote on the second video using the absolute category rating (ACR) scale. The data are translated to values ranging from 0 to 100 when calculating the mean opinion score (MOS) as Figure 3 shows.
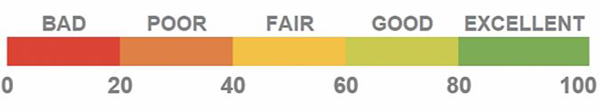
Fig. 3. Absolute category rating scale in numbers.
Our Use Case
Telecom has its own IPTV platform, called FLOW, based on set-top boxes and second screens. It provides different types of advanced video services, including linear TV, and various flavors of on demand services. Thus, it’s very important for the company to develop VMAF as a tool for optimizing FLOW customer experience.
FLOW Dataset
To train VMAF for optimizing FLOW customer experience we defined a dataset following Netflix’s suggestions regarding the type of content. We selected 35 videos, each 10 seconds long from the FLOW catalog. To make the distortions, each source video is encoded with six resolutions up to 1080p. The characteristics of the videos are variable, and we selected videos with fire, water, nature, animation, close-up, action, crowd, among others.
Subjective Test for 1080p Model
We ran a subjective test through six different focus groups. Each group comprised about 15 subjects. The observers watched about 20 source videos from the FLOW dataset following the methodology previously mentioned. Then, we defined the training and the testing datasets using 70% and 30%, respectively.
Training
After performing the subjective test, we trained the VMAF model with its results and the elementary metrics calculated to the videos of our training dataset. To do the training we ran the algorithms provided in the VMAF development kit using as elementary metrics the four VIF scales, DLM and TI. Then, we trained several models with different sets of parameters for the SVR and we found that the best was: C = 4 and σ2 = 3.
After training the models we calculated some performance metrics. The correlation coefficient was 0.7 and the prediction error was 19.9. We can see that the correlation metrics are not near 1, which is desirable, but we decided that its value was acceptable because of the type of experiment which includes subjective opinions.
Testing
Once we had our trained model, we tested it with the testing dataset previously defined. After the testing we calculated the performance metrics in order to measure the prediction accuracy. As expected, the correlation coefficient (0.6) was lower for the testing than for the training and the prediction error (25.3) higher. These results are indicating that we have to continue improving the model.
Proposed improvements:
• Training the model with a larger dataset, in this way, the algorithm could learn from more examples and be able to predict values for future instances with higher accuracy.
• Considering other elementary metrics or other combination of them.
• Finding more appropriate parameters for the SVR (C and σ2).
Future Work
Once we have our definitive model for 1080p, we are going to explore models for second screens and 4K to continue optimizing customer experience in other devices.
 Mariela Fiorenzo,
STEM Senior Analyst,
Telecom Argentina
Mariela Fiorenzo works for Telecom Argentina as a STEM Senior Analyst and has been in this role for the past eight years. She is responsible for broadband traffic and video services research, characterization of subscribers’ behavior and mathematical models development for different services. In her present position, she has developed a probabilistic model for sizing the VoD system to ensure the QoS of the company’s customers. She has worked in developing a model to describe traffic engineering considering the QoE as an essential parameter using machine learning techniques. Currently, she is also responsible for the technical analytics and KPIs of the IPTV platform of the company. In addition, she has been a regular speaker in several seminars at the company, and she participated in Cable-Tec Expo workshops in 2015 and 2016. She has been recognized with the Rising Leader Award during Cable-Tec Expo 2018. She holds a Master’s degree in Mathematics and a Master’s degree in Data Mining and Knowledge Discovery from Buenos Aires University, Argentina.