How Can NPR Improve Future 1.8 GHz Extended Spectrum Amplifier Characterization?
By Diana Linton
“It is only when they go wrong that machines
remind you how powerful they are.”
— Clive James, Australian writer and TV critic
Since the introduction of CATV hybrid amplifiers in 1968, these electronic “machines” have been an essential component in defining the capacity and broadband performance of the HFC network by allowing larger numbers of signals to be carried over coaxial cable with minimal degradation. The cable industry’s endless drive to offer improved high value and better-quality services that support migrations to all-digital networks has driven the development of high-capacity complex broadband RF amplifiers supporting expanded operating bandwidths, improved RF performance and greater reliability to provide highly competitive services. The DOCSIS 4.0 specification fuels this effort by opening the door to future RF spectrum expansions up to 1.8 GHz.
A comprehensive understanding, and complete performance characterization of new amplifiers, is therefore, critical to help operators make educated design decisions around 1.8 GHz HFC network upgrades. Implementing standardized testing will be key to allow the cable industry to compare performance parameters among actives at select frequencies. Currently, amplifier developers and cable operators use various metrics to evaluate digital signal quality through an amplifier including, but not limited to carrier-to-thermal noise (CTN), carrier-to-composite noise (CCN), carrier-to-intermodulation noise (CIN), bit error ratio (BER) and most prevalently modulation error ratio (MER).
MER measurements remain a good tool for characterizing amplifier performance; however, MER is not enough to fully portray RF performance of future 1.8 GHz amplifiers. We need to consider other parameters to help us better understand the total composite power (TCP) limitations of this new extended spectrum amplifier technology.
What is changing?
Future 1.8 GHz actives will amplify digitally modulated RF signals over wider frequency bandwidths producing intermodulation distortions caused by nonlinearities. Intermodulation distortion (IMD) products will surely increase as input signal levels increase and they will be a limiting factor in determining RF performance through any active. Therefore, it is important to quantify IMD in order to determine optimal amplifier input signal levels for the desired performance over the active’s maximum dynamic range.
There are different approaches to measuring multiple carrier interferences, such as two-tone and third-order test methods; however, as the number of digital signals increase, the input level profile and the distortions generated will begin to exhibit noise-like characteristics. A traditional measurement approach quantifies the impact of this noise on signal performance by measuring the receive MER (RxMER) degradation against a ‘known-good’ transmit MER (TxMER) measured at the output of an active. A challenge with this approach requires a high quality signal source, which is usually limited to no more than 53 dB of TxMER. This source limitation will hide the true performance of an active device with a CCN expectation to exceed 60 dB. A test equipment capability on the receive end will be equally important as there may be a requirement to use noise correction factors, which could add uncertainty to any measurement. These combined factors will mask the true fidelity of a 1.8 GHz amplifier’s performance.
Respacing amplifiers in the new designs remains a last option so the added output power increases in future 1.8 GHz actives could further complicate MER testing. With increased bandwidth in the higher portion of the spectrum it is important to be cognizant of the amplifier’s TCP limitations for expected performance. Of course, this will vary by vendor and may require implementing a signal level step-down at selected frequencies to stay within prescribed TCP limits. A step down directly impacts TCP and reduces overall signal levels into the device under test. This is where it gets more complicated because two MER signal sources may be required to achieve consistent TxMER levels across multiple input frequency ranges.
An old-new approach based on noise power ratio (NPR) may be better suited to measure noise and intermodulation distortion for capturing accumulated distortions from test signals across a variable range of input levels.
Why NPR?
NPR is not new to cable. In fact, NPR has been the standard used for many years to characterize RF upstream performance. The process involves loading the bandwidth of interest with either additive white Gaussian noise (AWGN) or digitally modulated signals creating a notch tuned to a frequency of interest and increasing the input signal level and then measuring the accumulated noise within the notch after passing through the device under test to generate a range of NPR readings. Using NPR works better over wider bandwidths with variable band characteristics, and can provide a higher dynamic range than MER measurements. This makes it a suitable metric measurement to fully characterized RF performance in the downstream as well. NPR plots are used to represent the RF output profile at one or more frequencies of interest for an amplifier under test, and across a range of input and output TCPs as shown in Figure 1.
From this NPR chart, the following can be inferred:
- The amplifier noise region. This is represented on the left side of the curve and increases approximately at a 1:1 ratio as the input power increases. This is where the power in the notch is dominated by thermal noise.
- The intermodulation region. As the top of the curve is reached the NPR curve starts to round. This is the area of the curve where the notch is dominated by intermodulation noise. For amplifiers with exceptional performance this area is either minimal or nonexistent.
- The clipping region. As maximum output TCP levels are reached and the RF amplifier is driven into saturation, the clipping region appears, where the power in the notch is ruled by high order intermodulation noise. In this region the NPR curve decreases quickly with an increase in input power.
- The dynamic range region. This is selected based on the target NPR.
- The peak NPR region. This is where the highest NPR measurement is recorded.
NPR-based test measurements are being considered as a sound method to characterize future 1.8 GHz amplifiers and initial testing shows strong correlation between NPR curves and traditional MER and BER measurements. The added benefit of using NPR is having the ability to determine accurately the boundary between the linear and non-linear (clipping) operating regions, and the ability to select the optimal input signal range for distortion-free amplifier operation.
What about MER measurements?
MER will continue to remain a predominant metric to measure performance. Cable operators will continue to count on downstream end of line RxMER measurements, as well as upstream RxMER (or CMTS derived SNR) measurements that leverage a cable modem signal, to provide perspective on the health of the signals in the plant and premises network. Understandably, MER measurements using customer premises equipment and lower cost signal level meters can be construed as having a lower dynamic range and may not adequately qualify the performance of future 1.8 GHz RF amplifiers in the plant so the same instrument must be used from beginning to end to capture system degradation. Because MER is both source and test receiver limited, predicting degradation over a cascade of amplifiers with different test equipment will yield results that vary.
How can we leverage an NPR approach and improve lab MER measurements?
Setting up an NPR test configuration to characterize forward and return path performance of future 1.8 GHz RF amplifiers will provide accurate results and is not difficult. NPR is starting to emerge as a reasonable alternative to MER in test labs, and although more complex, the effort to combine NPR and MER test setups can produce correlated NPR, MER and BER measurements when a more comprehensive device characterization approach is desired. Such a combined approach may require additional steps to be taken to improve the accuracy of lab MER measurements, including:
- The use of multiple signal generators to maximize TxMER when implementing a step-down.
- The use of separate high-performance DOCSIS 3.0 or DOCSIS 3.1 signal generators to support unique carrier frequencies to minimize the use of MER correction factors.
- The use of bandpass filters to prevent overloading of test receivers and/or signal analyzers that supports improved MER measurements.
- The use of DOCSIS SC-QAM carriers as a load rather than OFDM blocks for a more granular BER and RxMER measurements across the band.
There is more work to do to improve NPR and MER measurement techniques and both methods will be necessary to characterize future RF amplifiers.
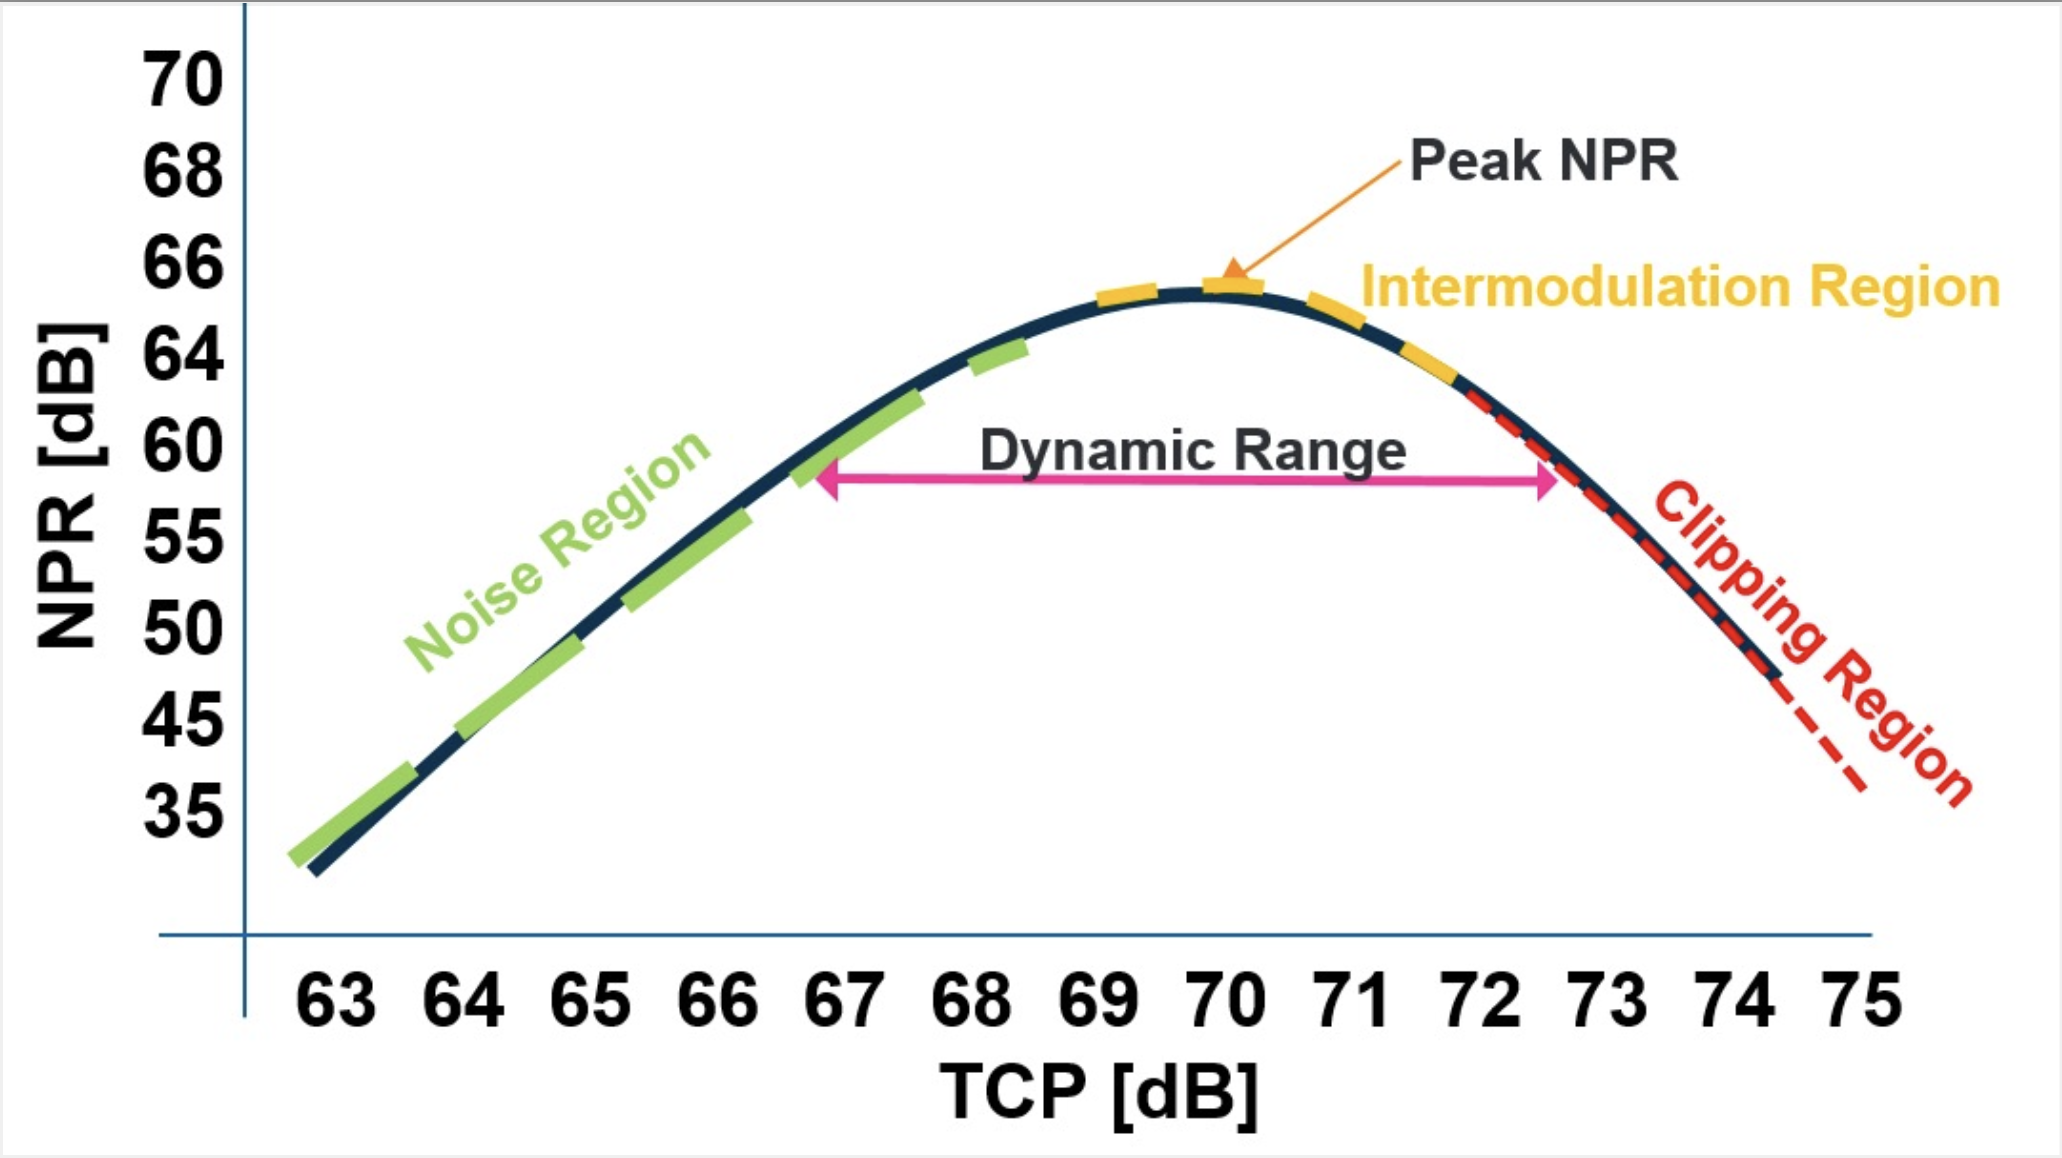
Figure 1. NPR chart

Diana Linton,
Network Engineer,
Charter Communications
Diana.linton@charter.com
Diana Linton is a Network Engineer working at the Charter Technology Engineering Center in Englewood, Colorado. She has worked closely with R&D Engineers for most of her career performing testing, tuning, and troubleshooting for military based products. At the end of 2020 Diana joined Charter to support plant network equipment qualification efforts and she actively participates in the development of extended spectrum RF solutions. She is an active member of the Rocky Mountain SCTE and WICT Chapters where she contributes to the success of the industry.