Frequency Response Testing
By Ron Hranac
A Peek Under the Hood
Cable network performance is dependent upon a variety of factors. Ensuring that a network provides high-quality signals to subscribers means maintaining proper active device alignment and correct signal levels to minimize degradation by noise and distortions; eliminating (and preventing, to the extent possible) external interference such as ingress and direct pickup; and being proactive rather than reactive with respect to overall maintenance practices. One of the most effective ways to help achieve optimum network performance is by what has long been called system sweeping, a method of characterizing and maintaining ideal frequency response. In addition to keeping network frequency response in check, it is equally important to ensure that in-channel frequency response (ICFR) is optimum.
What is frequency response?
Frequency response is one of several metrics that can be used to determine the performance of a component, device, system, or network. The term frequency response is more accurately called complex frequency response, the latter a measure of magnitude- and phase-versus-frequency. According to Wikipedia,
Frequency response is the quantitative measure of the output spectrum of a system or device in response to a stimulus and is used to characterize the dynamics of the system. It is a measure of magnitude and phase of the output as a function of frequency, in comparison to the input.
In cable industry vernacular, frequency response usually refers to just magnitude (amplitude)-versus-frequency and is a measure of the overall gain variation of a cable network or an individual channel as a function of frequency.
A simple measure of magnitude-versus-frequency response can be obtained by applying a continuous wave (CW) carrier of a certain amplitude at the input to a device under test (DUT), as shown in Figure 1. The CW carrier’s frequency is then varied or “swept” (while maintaining a constant amplitude) across a frequency range of interest for the DUT. The output of the DUT is measured and the results plotted graphically, usually on a display of some sort.
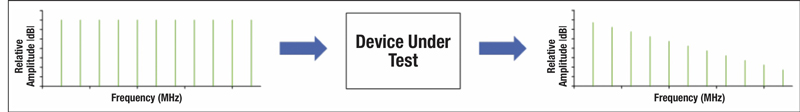
Figure 1. Measuring the magnitude-versus-frequency response of a DUT using a constant-amplitude CW carrier whose frequency is varied continuously or stepped across a frequency range of interest.
The frequency response of a cable network (or individual channels) can be measured in several ways, using methods that include the following:
- true broadband sweep testing — usually high-level or low-level, either of which can produce a high-resolution frequency response characterization
- “connecting the dots” — using the cable network’s existing active signals as a reference to determine frequency response, with resolution limited to the spacing of the active signals
- injection of specialized signals called sweep points at specific frequencies (including in vacant spectrum) that are used as a frequency response reference, often in addition to the network’s existing signals
- use of specialized analog baseband video test signals to determine the frequency response of headend modulators, and channel-specific sweep to determine the frequency response of headend processors
- observing a spectrum analyzer or similar spectrum display to get an approximation of the frequency response
- deriving ICFR from adaptive equalizer (or pre-equalizer) coefficients for single carrier quadrature amplitude modulation (SC-QAM) signals
A closer look at frequency response testing
Cable operators for decades have tested the frequency response of individual channels and the downstream and upstream spectrums in cable networks. Figure 2 shows examples of ICFR measurements.
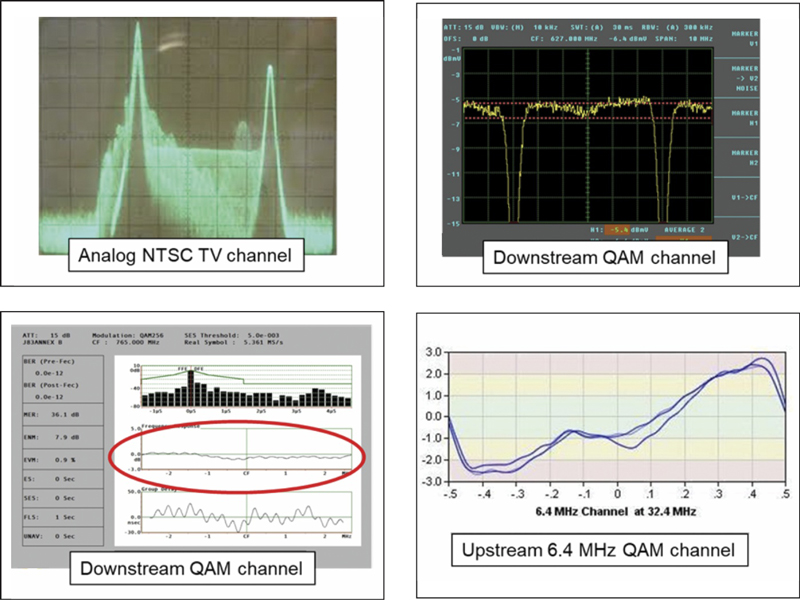
Figure 2. ICFR measurement examples. Clockwise from upper left: use of a SIN X/X baseband video test signal to characterize the in-channel response of an analog NTSC headend modulator; looking at the approximate ICFR of an SC-QAM signal using a spectrum analyzer; adaptive pre-equalization-derived ICFR of an upstream SC-QAM channel; adaptive equalization-derived ICFR of a downstream SC-QAM channel (circled in red).
ICFR measurements for analog TV modulators were performed using specialized baseband video test signals such as multiburst, multipulse, NTC 7 combination, or SIN X/X, either full-field or as part of a vertical interval test signal (VITS). A field-rate baseband video sweep signal was used for measuring in-channel frequency response, too. Analog headend processors were commonly measured using an RF sweep signal injected at the antenna input. The ICFR of digital channels over their symbol rate bandwidth can be derived from adaptive equalizer or adaptive pre-equalizer coefficients, and an approximation of a downstream SC-QAM signal’s in-channel response can be observed on a spectrum analyzer display.
Measuring the frequency response of the entire operating spectrum in cable networks has commonly been done using some form of broadband sweep testing. One version of broadband sweep testing involves transmitting a sweep signal from the headend through the distribution network to characterize the downstream. That sweep signal comprises a test signal whose frequency varies (“sweeps”) in a continuous or stepped manner across the bandwidth of the spectrum of interest. A receiver that is synchronized to the transmitter recovers the sweep signal during testing at various locations in the outside plant, allowing technicians to observe the frequency response. Sweep testing has been used to provide reference snapshots of the performance of the network at a given point in time, as well as for on-going or periodic alignment, maintenance, and troubleshooting of amplifiers and other equipment in the outside plant. Figure 3 shows examples of cable network frequency response measurements.
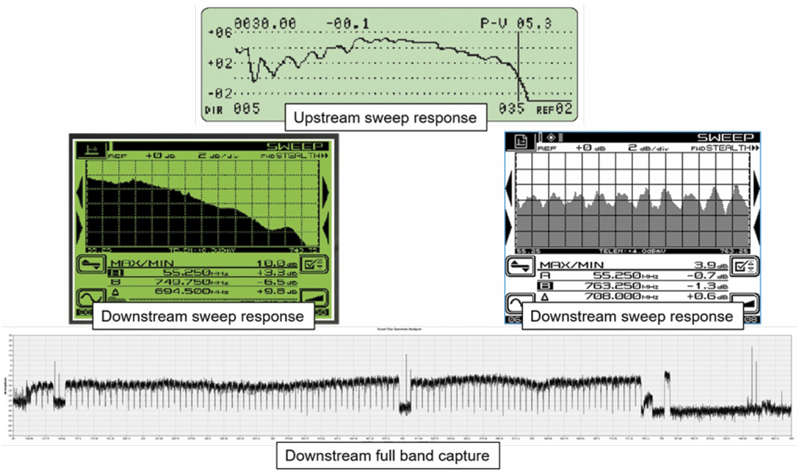
Figure 3. Examples of cable network frequency response measurements. Clockwise from top: upstream frequency response; downstream frequency response showing presence of amplitude ripple; full band capture display from a cable modem showing coarse response of the downstream spectrum; downstream frequency response showing excessive negative tilt.
Measuring frequency response
In most cases frequency response is measured or expressed in decibels (peak-to-valley or peak-to-peak) across a frequency range of interest. For example, the amplitude of a test signal or sweep signal at various frequency points is measured, with the results plotted on a graph or display of some sort. One can then determine the worst-case peak-to-valley magnitude-versus-frequency variation, as illustrated in Figure 4.
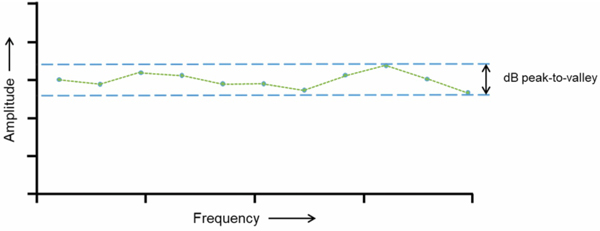
Figure 4. Frequency response flatness.
Ideally, the plotted frequency response should be as flat as possible. But what amount of flatness is acceptable? First, it is important to understand that the concept of frequency response flatness can be complicated by the fact that frequency response tilt exists in cable networks, such as the positive tilt at the output of an amplifier. Fortunately, commercial sweep equipment has often included the ability to normalize tilt so the response trace appears horizontal on the sweep receiver display, making it easier to interpret the frequency response. See Figure 5.
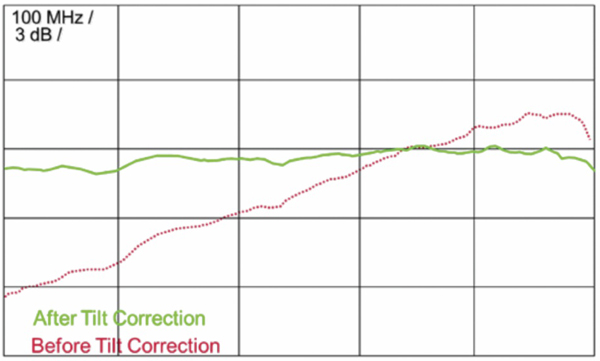
Figure 5. Sweep receiver tilt compensation example (graphic from a Wavetek Wandel Goltermann training presentation; courtesy of Viavi Solutions).
In the past the following formula was widely used to determine the worst-case acceptable frequency response flatness in a cascade of amplifiers.
dBpeak-to-valley = (n/10) + x
where n is the number of amplifiers in cascade, and x is a sweep response factor usually provided by the amplifier manufacturer.
In all-coax tree-and-branch networks whose highest downstream frequency was below about 300 MHz, x was usually equal to 1. For example, the targeted end-of-line frequency response flatness for a 220 MHz 25 amplifier cascade might be (25/10) + 1 = 3.5 dB peak-to-valley. As network RF bandwidth expanded beyond 300 MHz, x increased, too, to values such as 1.5 and 2. Over time — and as network bandwidth became even greater — the above formula was no longer satisfactory. These days many cable operators have developed their own specifications for desired response flatness.
Sweep or balance?
An amplifier alignment procedure variously known as balance, rough balance, or band edge balance has long been used for initial activation, adjustment, and quick checks of amplifiers in the outside plant. The procedure is straightforward: While measuring two RF signals — one at the low end of the downstream spectrum and the other at the high end of the downstream spectrum — a technician adjusts the amplifier to get its operation approximately correct with respect to input padding (attenuation) and equalization, and output RF levels and tilt. It’s important to understand that balancing amplifiers does not replace sweep alignment. Measuring the RF level of just the two signals cannot show what is happening across the entire spectrum.
Wrapping up
Measuring and maintaining proper frequency response has for decades been among the tools used by cable operators to ensure optimum performance of their networks. Many types of problems and impairments can be identified by what has long been called broadband sweeping. While some operators have reduced or eliminated sweeping as modern HFC architectures bring fiber closer to the home and reduce the amount of coax plant, frequency response-related problems still occur. Without an adequate means to characterize a network’s frequency response, some of those problems can remain hidden until they impact service to subscribers. As long as RF is present in cable networks, frequency response testing should be considered an important part of network maintenance.
Note: The material in this article was adapted from a paper by the author, titled “Developments in Cable Network Frequency Response Characterization.” The full paper — 43 pages! — is available in SCTE’s Journal of Network Operations, Volume 6, Number 2, December 2020 (https://www.scte.org/standards/journals/technical-journal-archives/).
 Ron Hranac
Technical Editor,
Broadband Library
rhranac@aol.com
Ron Hranac, a 49+ year veteran of the cable industry, has worked on the operator and vendor side during his career. A Fellow Member of SCTE and co-founder and Associate Board Member of the organization’s Rocky Mountain Chapter, Ron was inducted into the Society’s Hall of Fame in 2010, is a co-recipient of the Chairman’s Award, an SCTE Member of the Year, and is a member of the Cable TV Pioneers Class of ’97. He received the Society’s Excellence in Standards award at Cable-Tec Expo 2016. He was recipient of the European Society for Broadband Professionals’ 2016 Tom Hall award for Outstanding Services to Broadband Engineering, and was named winner of the 2017 David Hall Award for Best Presentation. He has published hundreds of articles and papers, and has been a speaker at numerous international, national, regional, and local conferences and seminars.