
COVID-19 Learnings
By Jeff Finkelstein
As Internet service providers we spend significant time planning for technology and service delivery. Some may say too much time as our budget cycle is now a year-long process. While we commit much of our time developing budgets, we spend even more time adapting our plans to meet the realities of the budgets that are granted. Then when we believe we have it figured out, we need to shift funds around to help cover shortages in other critical areas with unplanned-for events.
This, in a nutshell, describes 2020 so far. No one imagined we would be where we currently are in the delivery of services. We all had plans for improving our cable plants, moving to distributed access architectures, testing or deploying virtualized architectures, adding fiber, performing node splits, increasing spectrum, and more. Where we actually ended up is doing what was and is necessary to maintain the stability of our networks to meet the demands of our customers.
While we were surprised by current events, we were equally surprised by the resiliency and reliability of our cable networks. With the increased demands of work-at-home and school-at-home, our ability to adapt real-time to new challenges showed us how our past choices positioned us for the new realities of survivable networks. That is the leitmotif I discuss in this article.
Baby Steps
We all run capacity models time and time again. Change this, tweak that, what if this or that, etc. Many years ago, we started using the “Cloonan” bandwidth model developed by Dr. Tom Cloonan and his team at Arris (now Commscope). Almost 20 years later we still use a variation of this model for capacity planning.
The Cloonan model is elegant in its simplicity. For busy hour capacity needs we use:
Required Bandwidth Capacity =
Nsub*Tavg + K*Tmax
where:
- Nsub is the number of subscribers in the service group
- Tavg is the average bandwidth consumption of a single subscriber (during the busy hour)
- Tmax is the maximum bandwidth offered in the service level agreements
- K is the QoE coefficient, which is a value typically between 0.8 and 1.5 (larger values yield better quality of experience); K=1.2 is the typical value
In simple language, the bulk of the capacity is defined by the max speed offered plus a quality of experience value to add some headroom. The average capacity used by consumers to date is typically small in comparison.
At least until the pandemic hit…
What many of us have seen during these times is that our downstream usage has gone up for average usage by 25% and our upstream average has gone up by 40%. Taken by themselves it does not seem to be that much as our current downstream Tavg is ~3 Mbps and upstream is 300 kbps. If you add in the step function, we end up with a Tavg of 3.75 Mbps DS and 450 kbps US.
However, you need to multiple it by the Nsub value to see the real impact. DS usage for a 250 HHP node goes from our current 750 Mbps to almost 1 Gbps. US usage increases from 75 Mbps to 112 Mbps. For those of us in North America or elsewhere with a 5 MHz to 42 MHz upstream, the upstream increase uses almost all the spare headroom that is available. This has the potential to “shift” some of the nodes approaching congestion over the line into a congested state.
Putting into graphical form, let’s look at the NCTA collected data from numerous operators in the US and Canada.
Downstream usage (Figure 1) varies based on a number of external factors including game updates and vacations but compared to the 03/01/2020 baseline as of 09/12/2020 it shows a 15% growth.
Upstream usage (Figure 2) is more consistent as work from home has been an ongoing growth factor. With the restart of schools using a learn-from-home methodology, we can see the upstream growth increasing from early August and continuing the trend. From the 03/01/2020 baseline to 09/12/2020 the growth is ~30%.
While we do not know how this will play out over time, we can make some assumptions. Schools are starting to allow students into the classroom on a rotating basis and the expectation is that it will continue through the school year. If 20% of students are back in the classroom on any given day, that will help lower the usage curve. Offices are for the most part very limited in allowing employees to come in, but I think that they will begin a similar rotation for some employees on either a daily or weekly basis. This will help further mitigate the growth.
Whether classrooms or offices are at 25%, 50%, or other occupancies, there will be some who will not return until things are more stable. This will continue to drive the growth above our previous plans and require new ways of thinking.
In any scenario, we need to continue with our plans for supporting the growth we have seen to date. I do not expect that a return to a new normal will happen until mid 2022.
What to do now
We have been fortunate in the work done in DOCSIS specifications and technologies as it has held up extremely well. The excellent work done in MAC scheduling optimizations by our vendors both silicon and system are largely responsible for the way things have held together. TCP/IP itself has been a large factor for how well things continue to work. But there is still much we can and need to do.
Some of the low-hanging fruit for the downstream includes:
- Reclaiming analog spectrum for use by digital services including DOCSIS SC-QAM and OFDM, switched digital video, and digital video
- Running into the roll-off by bit-loading OFDM or using SC-QAM signals at a reduced modulation
Upstream things to consider include:
- Removing or reducing guard-bands between carriers
- Increase modulation to 64-QAM
- Use as many 6.4 MHz carriers as possible
- Replace a 6.4 MHz and 3.2 MHz carrier with a 9.6 MHz OFDMA block
- Segment or split the node to reduce HHP per service group
- Move to a mid- or high-split architecture
It is an ineffable truth that creating more upstream capabilities means changing out technologies. We can push existing technologies a long way, but the good Dr. Shannon remains unfazed by our desire to prove him wrong. In the end one of the greatest gifts we can give the next generation of cable engineers is more spectrum to work with when defining future technologies.
How long will it last
A favorite quote of mine is from Abraham Lincoln. He was once asked “How long should a man’s legs be?”. His answer was simply “Long enough to reach the ground.” So how long should we expect technologies to last? My answer is as long as possible, but no longer.
Generationally each version of DOCSIS has given us between 8-10 years. I expect that DOCSIS 3.1 will last in many cases until 2030 or so. DOCSIS 4.0 and its possible follow-on releases have the potential to last to 2040 or a bit longer. For many of us old cable dogs rapidly approaching retirement, we are excited to see the younger generation of cable pups take things to the next level.
Will there be a DOCSIS 5.0? Why not? Quite possibly we can extend the spectrum to 6 GHz or replace OFDM with something new. As I like to say, cable has and will continue to have a long, long, long useful life.
—
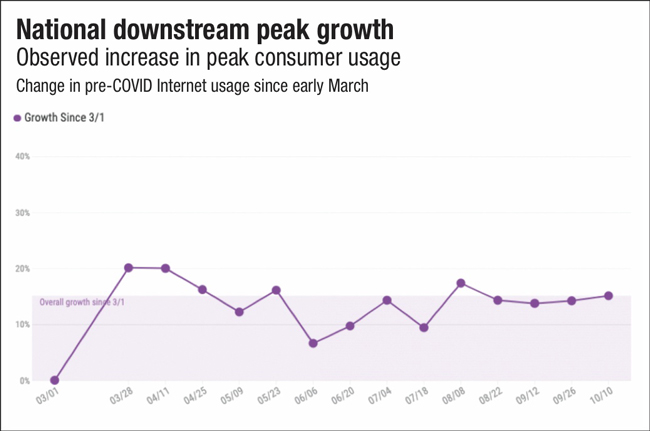
Figure 1.
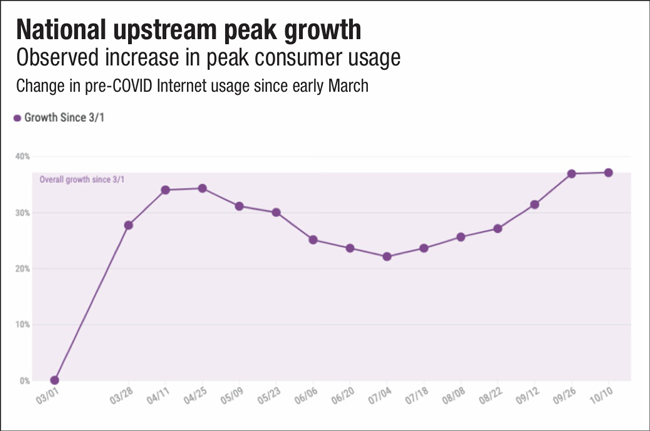
Figure 2.
—
 Jeff Finkelstein
Chief Access Scientist,
Cox Communications
Jeff Finkelstein is the Chief Access Scientist for Cox Communications in Atlanta, Georgia. He has been a key contributor to engineering at Cox since 2002 and is an innovator of advanced technologies including proactive network maintenance, active queue management, flexible MAC architecture, DOCSIS 3.1, and DOCSIS 4.0. His current responsibilities include defining the future cable network vision and teaching innovation at Cox. Jeff has over 50 patents issued or pending. He is also a long-time member of the SCTE Chattahoochee Chapter.
Shutterstock